

You Can’t Fix What You Don’t Understand
“The greatest obstacle to discovery is not ignorance—it is the illusion of knowledge.” — Daniel J. Boorstin


Rosie the Riveter knew.
They were building planes, tanks, and weapons at a scale the world had never seen. But speed alone wasn’t enough — reliability on the battlefield was the true measure of quality. And that required a new way to think about production.
So the U.S. government taught statistical thinking on the factory floor. Thousands of frontline workers were trained to understand variation and spot defects with precision. Not just inspectors or engineers — operators, machinists, line workers. Even Rosie the Riveter.
The underlying ideas came from two minds you may never have heard of: Walter Shewhart and W. Edwards Deming. Shewhart invented the control chart. Deming transformed it into a leadership philosophy rooted in systems thinking, variation, and respect for people.
Their work laid the foundation. America just applied it.
We Lost the Thread
Most managers today never learned what Rosie knew. Today’s leaders are handed metrics without method — and spend their careers reacting to spreadsheets. They call it being “data-driven,” but it’s really just reacting to noise without context or understanding.
When a number dips, they don’t ask what changed — they ask whether they’ll still be green by month’s end. Most don’t investigate; they do calculus in their heads. Will this roll up poorly? What actions will be expected? Their next move isn’t guided by data, but by bias, heuristics, and fear of looking bad in front of their boss.
They’re solving problems that never existed.
Because they were never taught to ask: Is this variation normal, or is it a signal?
Statistical Process Control answers that question. It teaches you the difference between common cause variation (inherent to the system) and special cause variation (a true signal). Without that knowledge, every bump looks like a cliff.
Precision Lost
Modern operations feel a lot like those maze puzzles where you tilt the board with two knobs to guide a ball. When you’re close to the action, the feedback is instant. You adjust. You learn. You see the pattern.
But in today’s corporate structure, leaders are turning those knobs from ten feet away, blindfolded, and someone else is holding the board. Then they wonder why they can’t hit their targets.
SPC is arguably the easiest and most impactful method that puts you back in control. Not by tightening your grip, but by helping you see the system clearly. It gave ordinary people the power to understand variation and act with precision.
We traded that for KPI dashboards and vibes.
I’m suggesting we pull it back in. Now.
An Example: Pounds per Labor-Hour (PPLH)
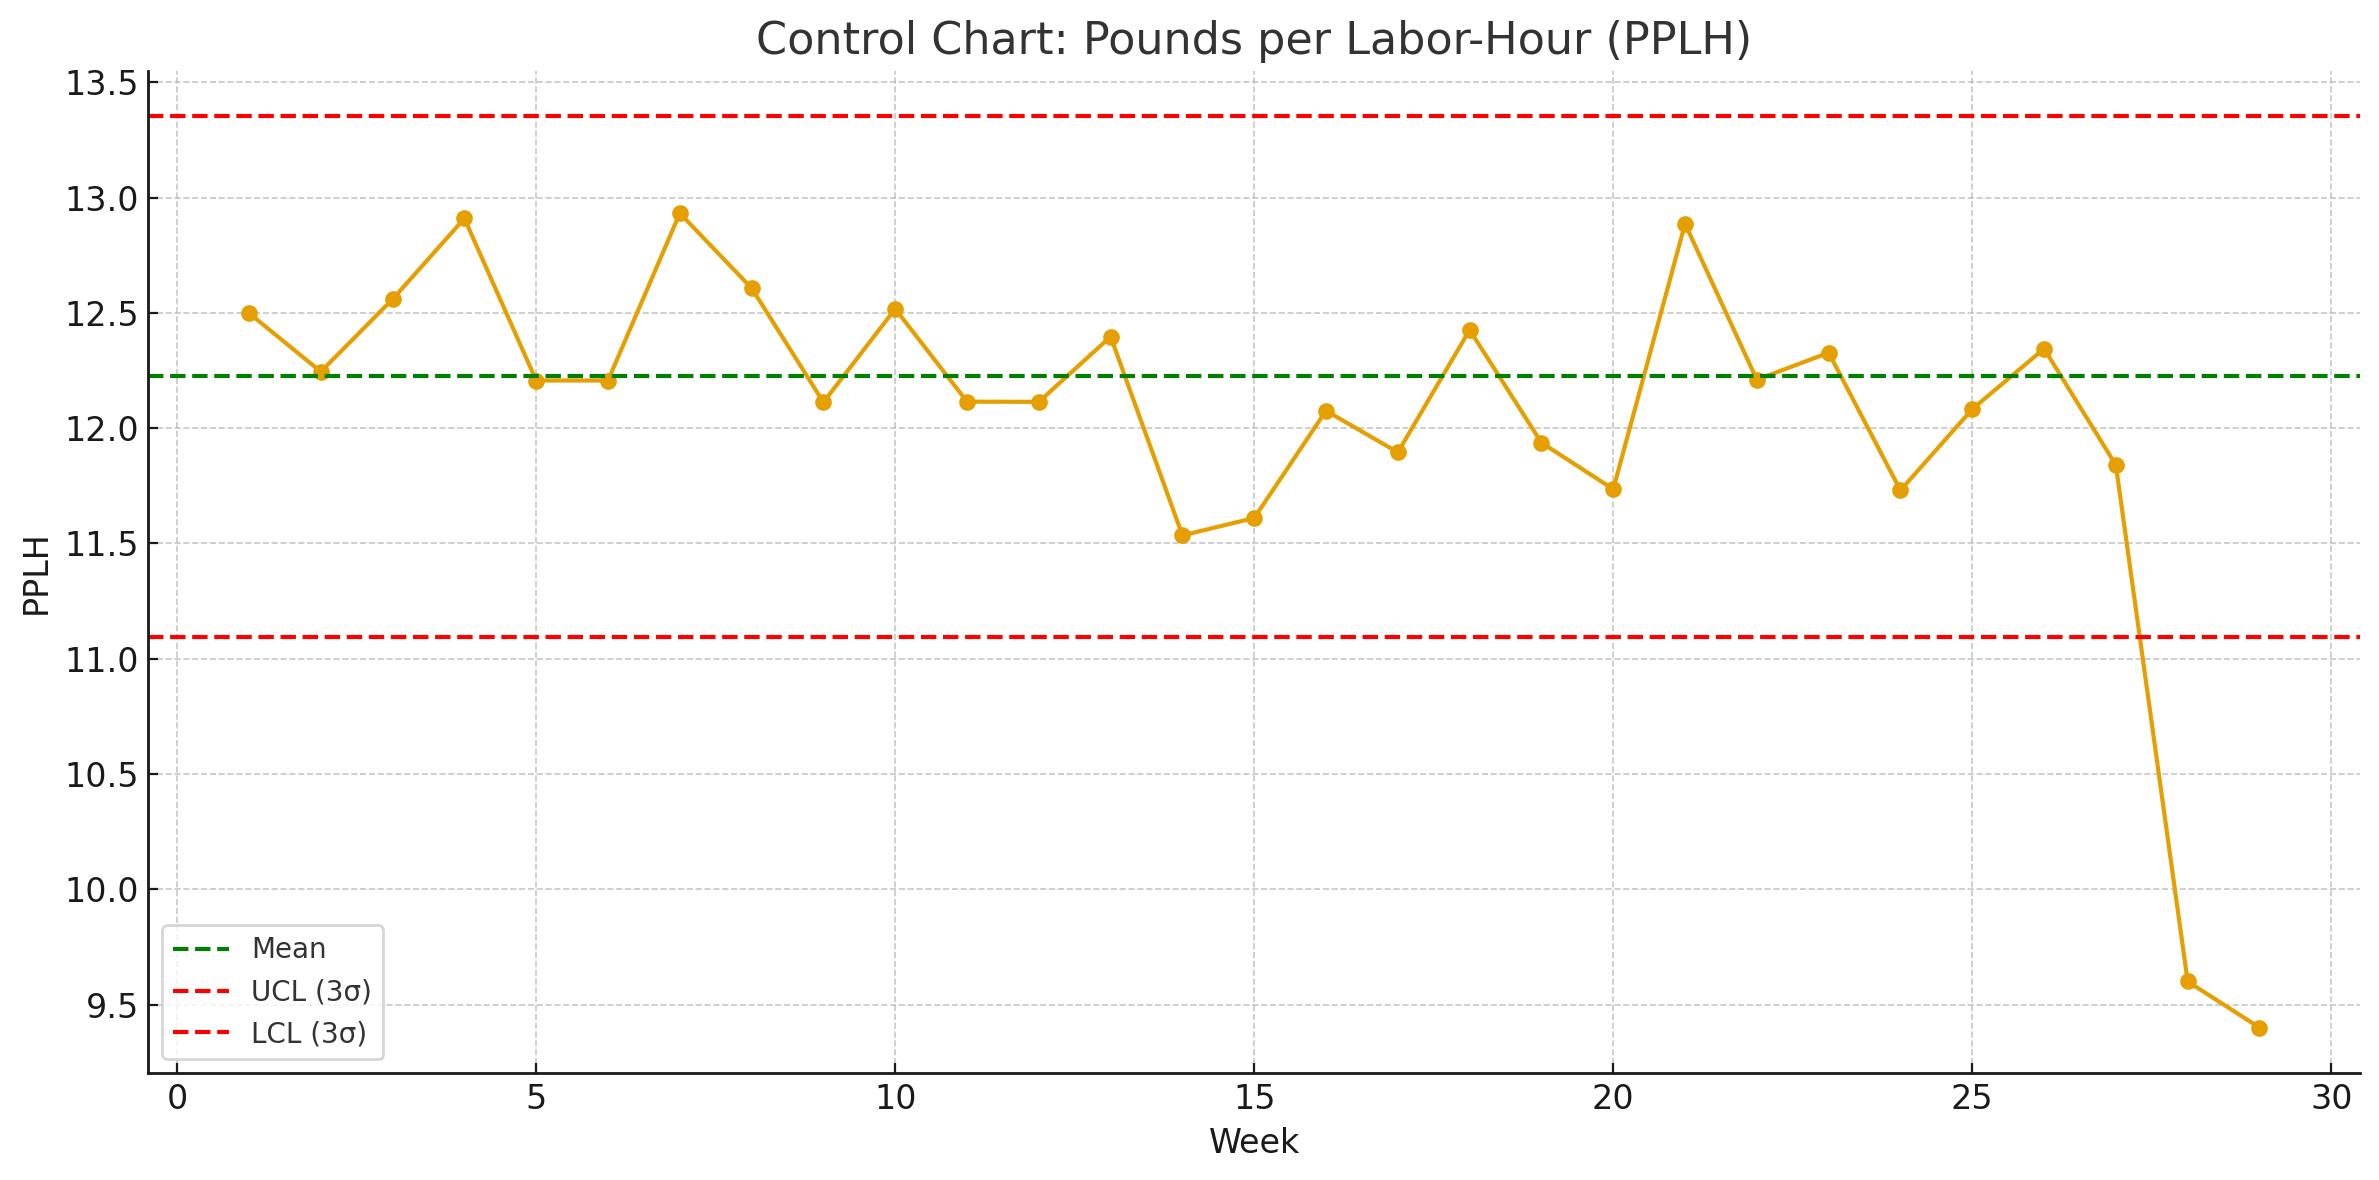
Let’s say you manage a distribution center, and your regional VP wants to discuss labor efficiency. The metric: pounds per labor-hour (PPLH). It’s red on the dashboard, and that’s all they give you.
In most sites, there’s a meeting where supervisors are asked to recall recent workdays and remember anything out of the ordinary. If you understand SPC, you skip the speculation. You go to the data and chart it.
Average output: 12.3 PPLH
Most weeks: 11.5 to 13.5
Then two weeks drop to 9.6 and 9.4
SPC flags it instantly — not as a gentle nudge, but a jump-out-at-you drop below control limits.
Instead of panicking, you dig.
The first dip coincides with the rollout of a new automated sorter. Operators weren’t fully trained, and misfeeds required double handling — dragging down throughput. The second week? You had three temps unfamiliar with the layout, causing congestion in high-velocity pick mods.
Now imagine this conversation in your monthly site review.
Instead of defending a red cell, you show the chart.
You say, “Here’s our system’s typical range. Here’s the moment we fell out of control. And here’s what caused it — not speculation, but a clear signal.”
No politics. No blame. Just root cause tied to real events, with a plan to improve: better onboarding for temps, staggered rollout for new tech, cross-training in high-volume lanes.
That’s what SPC does. It gives leaders context. It shifts the conversation from anxiety to clarity. And it earns you something you can’t get from a dashboard alone: credibility.
Not because the numbers are good.
Because you understand them.
Leaders, This Is on You
You were never taught this. That’s not your fault.
But it is your responsibility to learn it now.
Because once you do, everything changes.
“In God we trust. All others must bring data.”
— W. Edwards Deming
Even the monthly site review — that grim theater of red-yellow-green charts and half-hearted root causes — becomes something else. With SPC, you don’t debate opinions or plead context. You bring evidence. You don’t fight over blame. You trace signals. Your team begins to distinguish the meaningful from the noise, and strategies start to converge.
Root causes aren’t wild guesses anymore. They’re plotted patterns. Actions become focused. Improvement becomes visible. And trust — that rarest commodity in today’s workplace — starts to rebuild. Not because of slogans, but because people finally feel in control of their own work.
You cannot lead a system you don’t understand.
Start here.
Plot your own data.
Ask better questions.
Teach your people the difference between noise and signal.
Because when you see variation clearly, you don’t just improve the process.
You improve everything.
Sources & Notes
W. Edwards Deming, Out of the Crisis, 1982.
Walter A. Shewhart, Statistical Method from the Viewpoint of Quality Control, 1939.
“SPC and the American War Effort,” Quality Progress, ASQ Archives.
U.S. War Production Board training manuals, 1943–1945.
Todd Owings, Personal SPC Application Archive.
[Rosie the Riveter image and SPC wartime training archive visuals included here.]